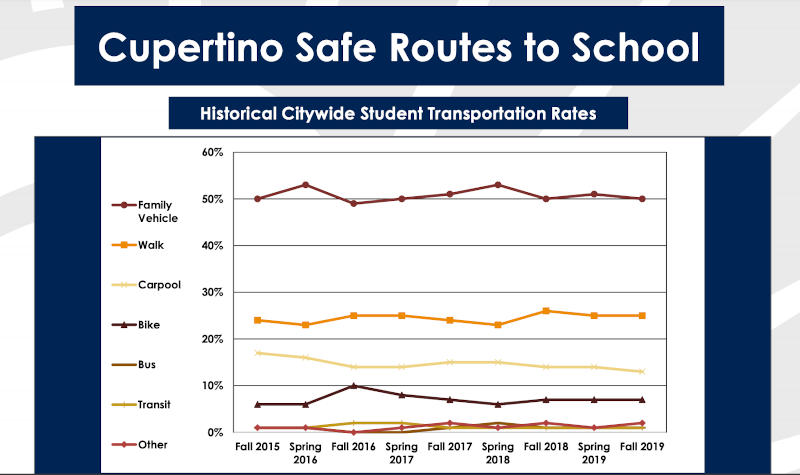
Recently, both CUSD (Cupertino Union School District) and FUHSD (Fremont Union High School District) announced their reopening plans in April. After more than a year of shelter-in-place, school families are finally preparing for this exciting yet challenging transition from virtual learning to in-person instructions. One of many choices they need to make is how students travel to and from school. Since Fall 2015, Cupertino Safe Routes to School (SR2S) has been collecting this data to better understand citywide student transportation trends across all grade levels.
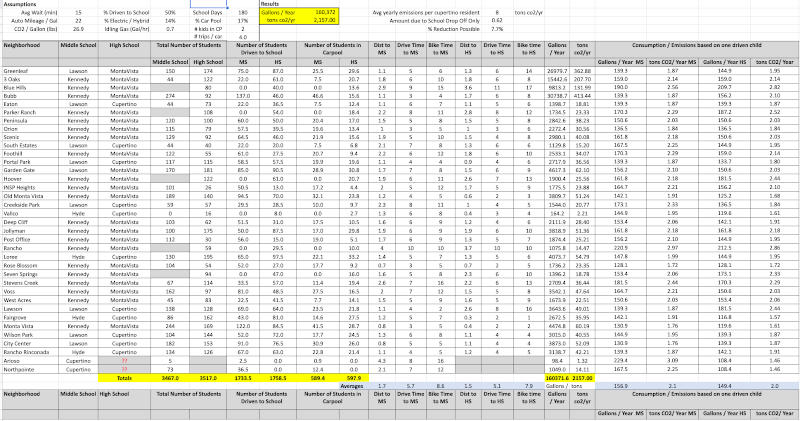
As an advisory board member of Walk-Bike Cupertino, I used the student distribution data posted on the Walk-Bike Cupertino website, the SR2S transportation surveys, and other public sources to model the climate impact of driving to school in Cupertino.
Click to read a related study “How green is cycling? Riding, walking, ebikes and driving ranked — Could cycling help tackle the climate crisis?”
Click to view the full slide deck “Fall 2019 Student Transportation Survey Results”.
Referring to the latest SR2S transportation survey, approximately half of students in CUSD and FUHSD were driven to school in family vehicles from Fall 2015 to Fall 2019. The other half chose alternative travel modes, including walking, biking, or carpooling, which reduce the climate impact and improve fitness and health. In addition, one major factor that favors biking to school is that it is not permissible nor safe to drop off children on the street near the school. As a result, cars need to queue up in order to drop off students in the approved locations in the school parking lot. Most of the gasoline consumed and carbon generated is due to vehicles idling while waiting in the queue.
- 160,000 gallons of gasoline
- 4,000,000 lbs of Carbon Dioxide
Do you want to make a difference? Try biking to school a few days a week, because
- it is faster
- it is better for you
- it is better for the environment
- and it is fun!
