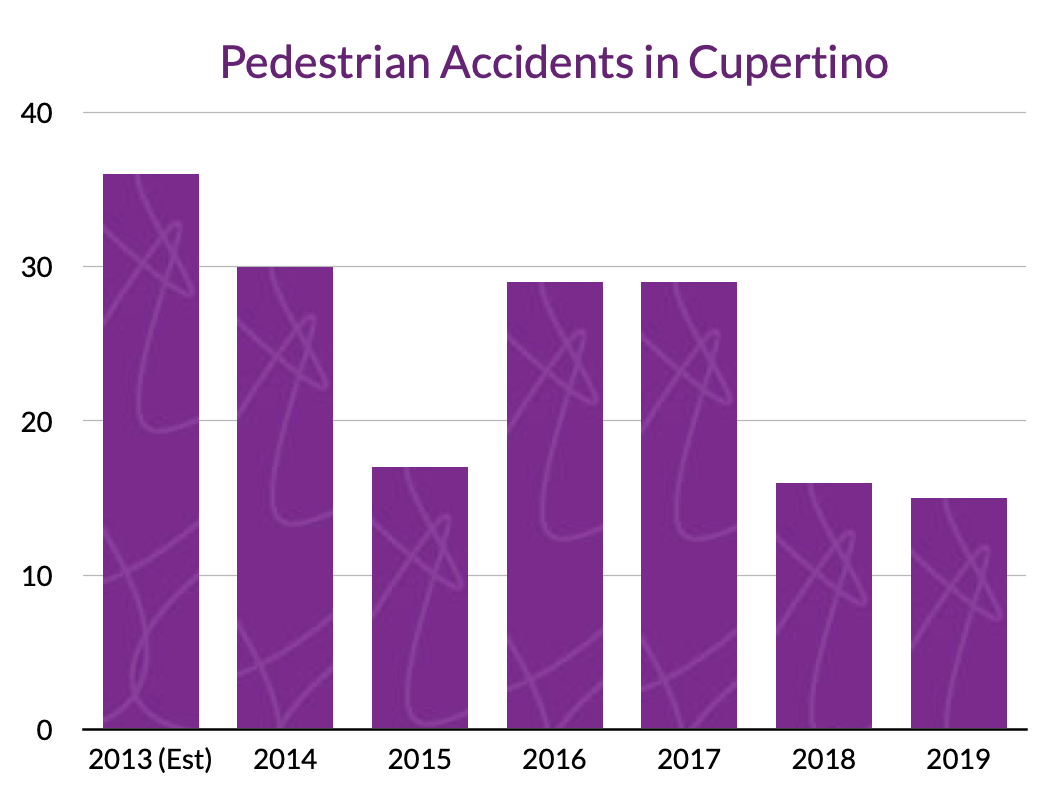
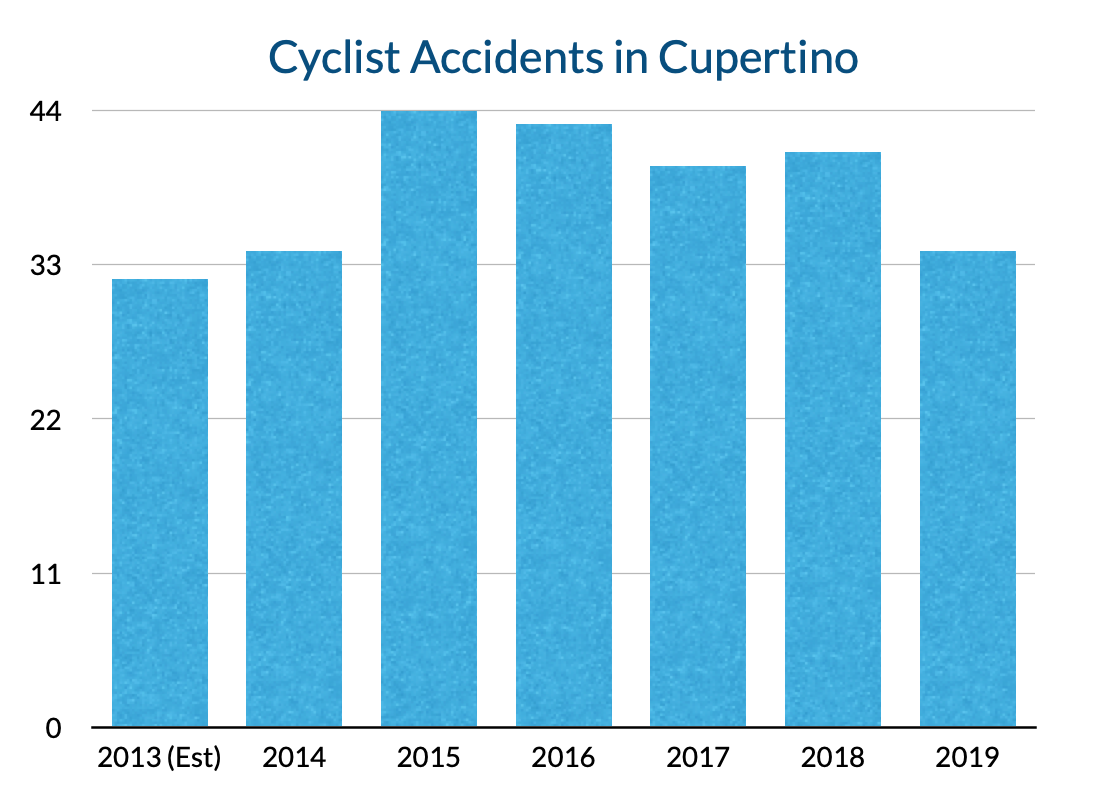
Over the past four years, Cupertino has seen fewer accidents each year between cyclists, pedestrians and vehicles. Any resident will tell you that traffic has increased (aside from after March 2020), which usually increases crashes. So why are we not seeing more of them, instead of fewer? And where are the “hotspots” for potential accidents?
Pedestrian accidents in Cupertino have made significant declines in the last two years, with a trend that is steadily declining over the past 6 years.


Cyclist accidents have not seen the same great downward trend as pedestrian accidents over the past 7 years, but since 2015, the trend has been downward.
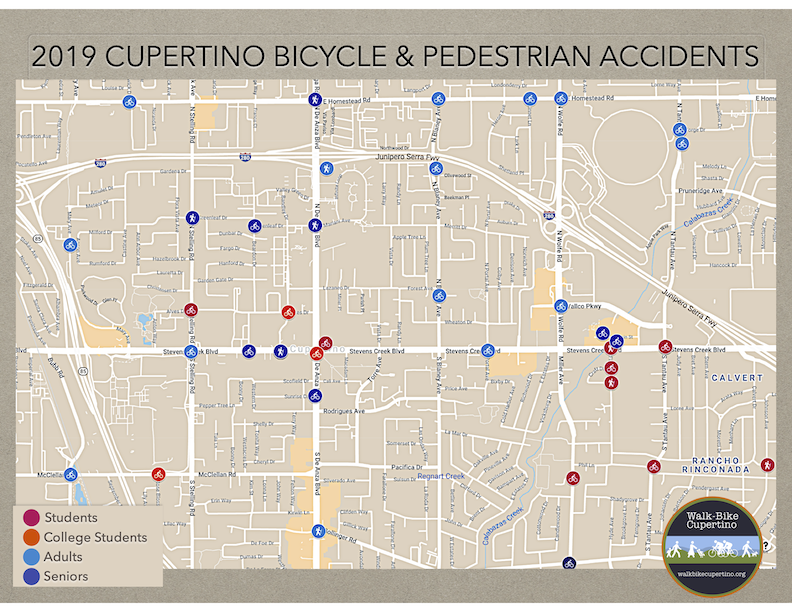
As shown in the map below of 2019 accidents, 70%+ of crashes occur in the high-volume traffic corridors of Stevens Creek and the city’s main traffic arterials. Each marker shown below is an accident that was reported to our Santa Clara County Sheriff.

Why are the number of accidents declining? Based on surveys, Walk-Bike Cupertino has determined that the following has likely improved safety and reduced crashes:
- Decreased cycling on major roads (especially on McClellan Ave, prior to implementation of Class IV green painted bike lanes completed late 2019);
- Increased training via Safe Routes to School student training and other adult training;
- Increased driver awareness of cyclists because of city discussions on new cyclist infrastructure being implemented, especially with Apple’s donations; and
- Increased visibility of the great desire by residents for walking and biking improvements in Cupertino.
Depending on the ages of pedestrians and cyclists, they experience crashes at dramatically different rates. For a discussion on this, click here.
Since 2013, Walk-Bike Cupertino has been collecting accident information from the Santa Clara County Sheriff, which has jurisdiction in Cupertino. It does not include vehicle only incidents or traffic citations nor any unreported auto/bike/ped crashes, which based on extensive national and international studies show are an extremely high percentage, especially for accidents that include only minor injuries.
We should also note that while Cupertino City officials are concerned and vigilant, the level of incidents may not be statistically out of the norm for a community of Cupertino’s size. WBC shares this data to help our readers appreciate the need for the re-engineering our city intersections, walk-ways and bike-ways for the safety of our children and community. The links to annual accident information files (CY2018 and CY2019) are here for bicycle/auto crashes and pedestrian/auto crashes.
The information in this article is solely the opinion of the author and Walk-Bike Cupertino and does not reflect the opinions of any other organization or entity. For more information, contact WBC at info@walkbikecupertino.org.
