For the past 3 ½ school years, volunteers from Walk Bike Cupertino and the Rotary Club have visited each of our high schools to count the total number of student bicycles. Compiling this work has provided an in-depth look at recent trends in student biking across high schools in Cupertino, revealing a record high number of students biking and an increased percentage of students opting for this eco-friendly commute.
This upward trend indicates growing interest and positive cultural shifts toward sustainable transportation, plus the efficacy of all the alternative transportation incentive programs. While Cupertino High School and Monta Vista High School lead with the highest bike counts, some other schools like Homestead and Fremont High are still catching up, reflecting variations in biking culture and infrastructure across the district.
Cupertino High School stands out with impressive biking numbers, showcasing a well-established culture of students commuting by bike. This trend may be attributed to a combination of school-specific factors, such as greater community engagement in bike-friendly initiatives and supportive infrastructure that makes biking to school easier and more appealing. Monta Vista High School and Lynbrook High School also report high biking counts, likely because of their more accessible enrollment areas and focus on increasing their biking student population through education and incentives.
However, not all schools have experienced such success. Homestead High and Fremont High report only modest increases in bike counts, showing that there are challenges preventing students from biking to these campuses. Likely factors include the distance from attendance neighborhoods, lack of safe biking infrastructure on the school commute, and lack of a biking culture at school. Identifying and addressing these barriers could enable these schools to foster a more robust biking culture.
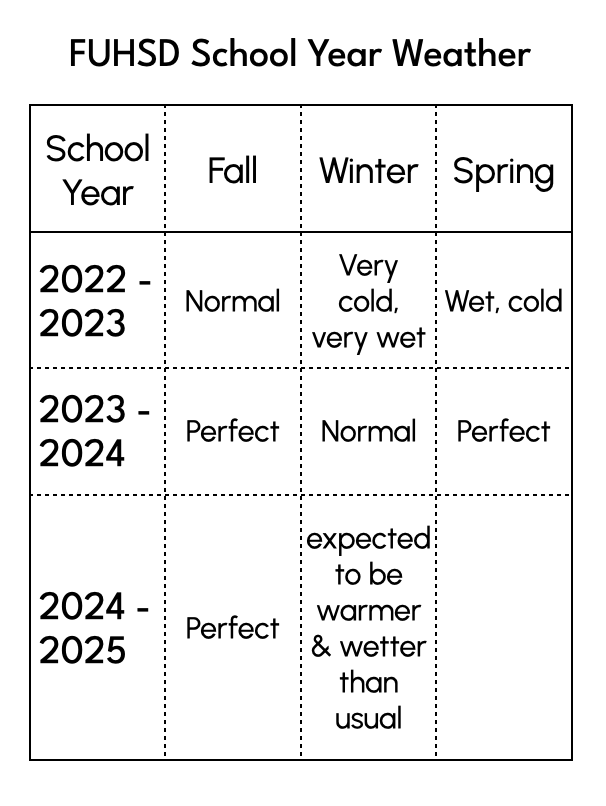
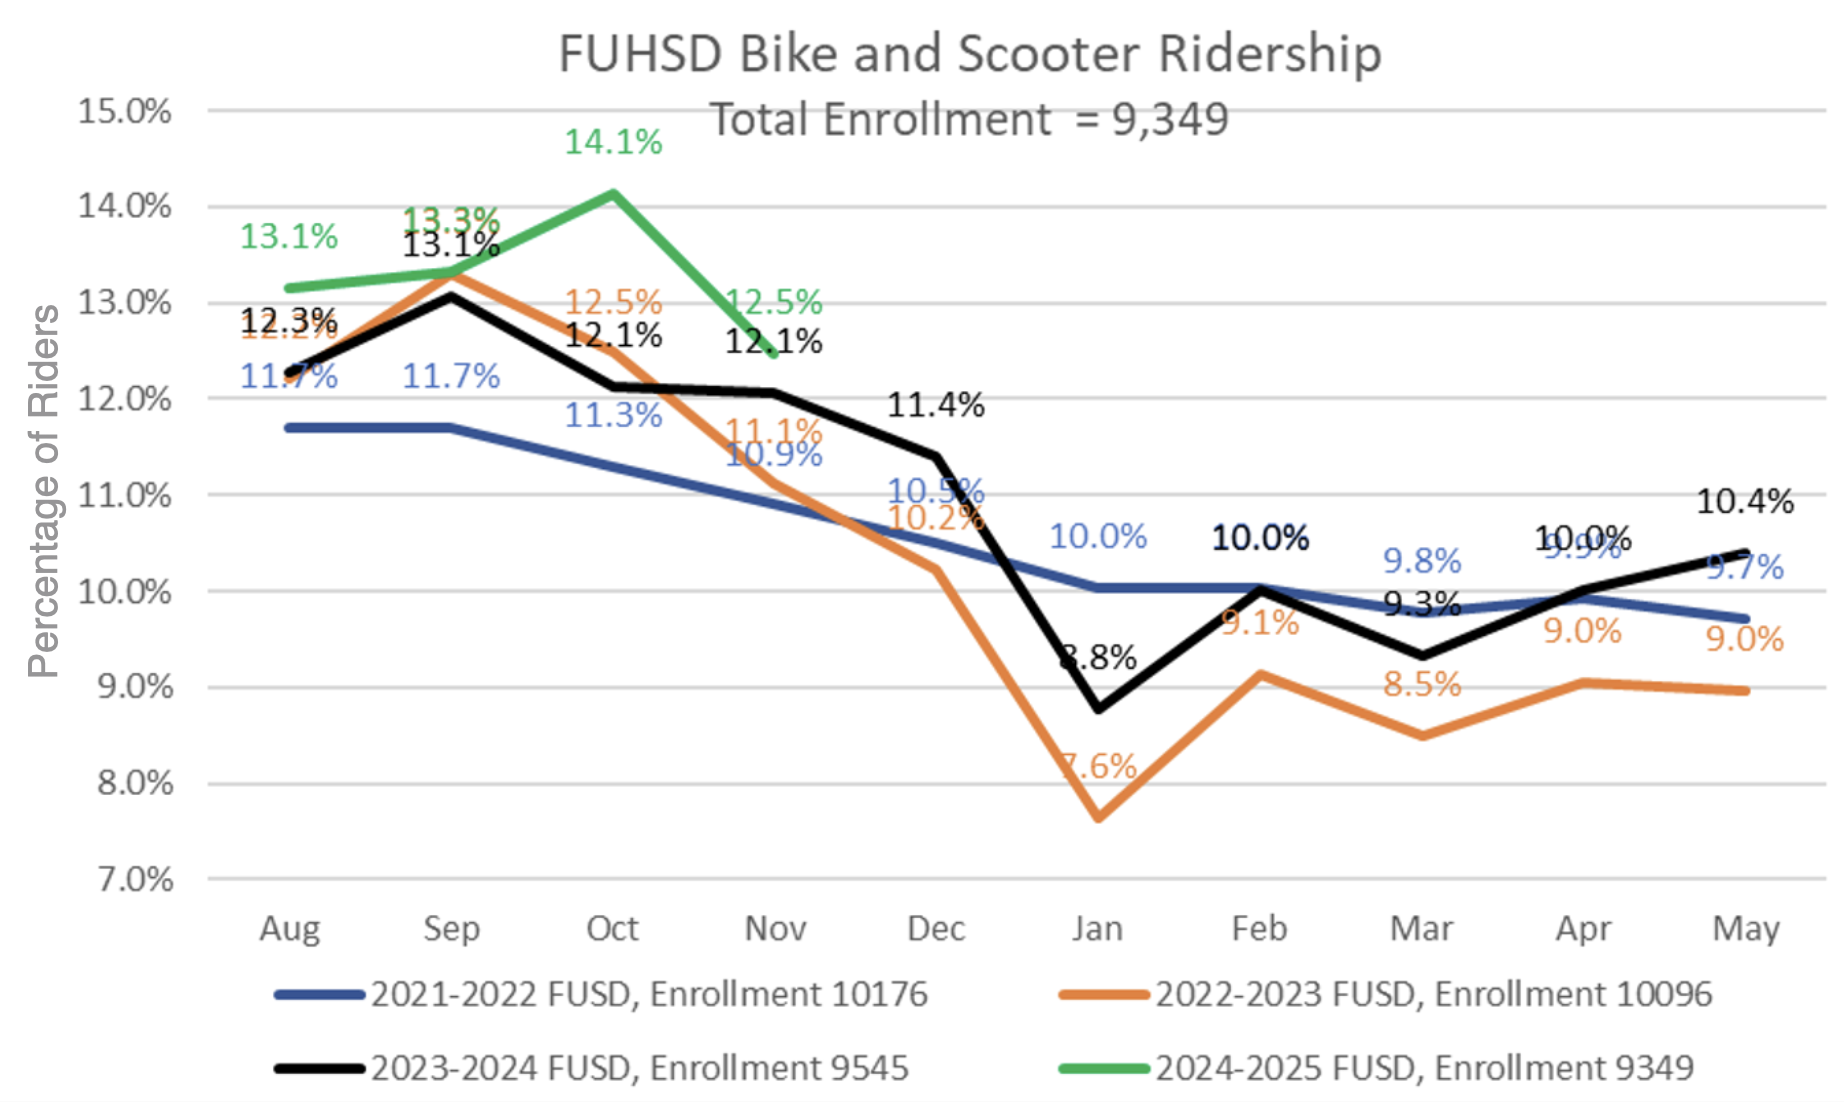
The work also shows some consistent bike usage trends. A much greater percentage of students bike at the beginning of the year than by the end. The cold and rain of winter can dissuade biking, and once students are driven to school, they often do not go back to biking. Not surprisingly, the weather patterns in a given year can also affect the overall number of cyclists. For example, the 2022-23 school year (orange line) had an unusually cold winter and spring which exacerbated the drop in cyclists seen every year during the winter. The 2024-2025 year so far has also seen favorable biking weather, with only minor rain interruptions in November. These weather patterns underscore the importance of ideal conditions in encouraging biking and suggest that further improvements, such as weather protection measures, could sustain biking rates through less favorable seasons.
It’s important when using these graphs to compare the percentages and the trends instead of the overall number of cyclists. Schools with larger student populations, such as Cupertino and Monta Vista, will naturally have higher absolute bike counts. As enrollment is also expected to decline by 2,000 students in the next five years–a substantial amount–it becomes more important to compare percentages and trends instead of the raw numbers.
By measuring month-over-month totals for bikes at each FUHSD site, the ‘bike count’ data offers an interesting look into where additional investigation and mitigation is needed to increase the number of cyclists at our schools. Studies have shown that biking or walking to school increases concentration and leads to better school outcomes, along with providing healthy exercise for students in an easy manner–plus improving our road traffic for everyone. If you’re interested in helping with the bike count program for your local school, please contact us at info@walkbikecupertino.org.
